What is the value of (p2-p1) ?
The bar graph shows the sales of bike and cars of five companies J, K, L, M, and N.
बार ग्राफ पाँच कंपनियों J, K, L, M और N द्वारा बेची गई बाइकों तथा कारों की संख्या को दर्शाता है।
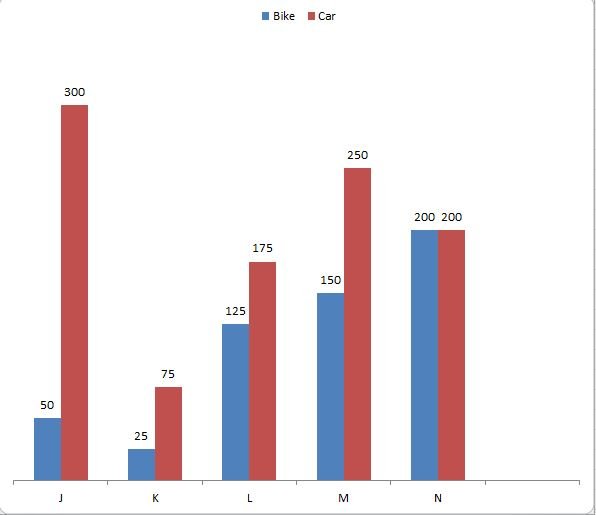
P1 = The total sales of bikes of all the 5 companies. / पाँचों कंपनियों द्वारा बेची गई बाइकों की कुल बिक्री।
P2 = The total sales of cars of all the 5 companies./ पाँचों कंपनियों द्वारा बेची गई कारों की कुल बिक्री।
Q. What is the value of (p2-p1) ?
(P2 – P1) का मान क्या है?
Detailed Solution & Logic
Correct Answer:
450
Similar Practice Questions
Which factory/factories showed a decrease of 25% in the production of scooters in 1989 as compared to 1988?
Study the table carefully and answer the questions given below. Yearly production (In thousands) of...
In which year was the difference between the highest marks and the average marks in History
Year / वर्ष English (Maximum) / अंग्रेजी (अधिकतम) English (Average) / अंग्रेजी (औसत) Mathematics (Maximum)...
The maximum rise in the production of raw wool was in which year?
Directions (86–90): Study the graph given below and answer the following questions. निर्देश (86–90): नीचे...
What is the average production of trucks (J2) by all the 5 companies?
The table given below shows the production of bike and truck by five companies. नीचे...
What was the percentage increase in the production of barley in 2019 compared
Year / वर्ष Wheat / गेहूँ Rice / चावल Barley / जौ Other Grains /...
Total number of players participating in Game D from all schools is what percentage of the total number of players participating in Game E from all schools?
Study the given graph carefully and answer the question that follows. दिए गए ग्राफ का...
In the year 2019, the commission earned by Salesman D was approximately what percent
Directions (91–95): Read the following table and answer the questions given below it. निर्देश (91–95):...