The maximum percentage decrease in production over the previous year was in which
Directions (86–90): Study the graph given below and answer the following questions.
निर्देश (86–90): नीचे दिए गए ग्राफ का अध्ययन कीजिए और निम्नलिखित प्रश्नों के उत्तर दीजिए।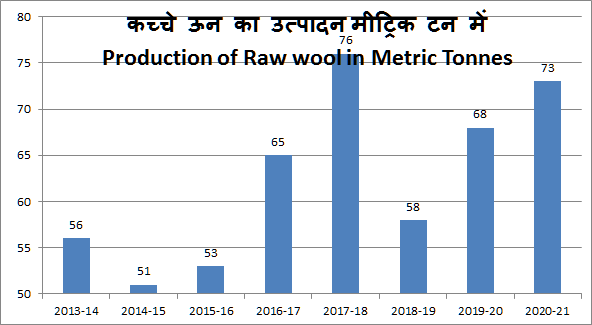
The maximum percentage decrease in production over the previous year was in which year?
पिछले वर्ष की तुलना में उत्पादन में अधिकतम प्रतिशत कमी किस वर्ष हुई थी?
Detailed Solution & Logic
Correct Answer:
2018-19
Similar Practice Questions
Approximately what percentage of the total employees working in the Sales department
Study the pie chart and the table given below and answer the questions that follow.नीचे...
If the investment by NRIs is ₹ 8,000 crore, then the combined investment by Companies and FII in Bharat Bonds is
Directions : The following pie chart shows the subscription generated for Bharat Bonds. Study the...
The sales of car is how much percentage more then the sales of bike in companies L ?
The bar graph shows the sales of bike and cars of five companies J, K,...
In 2018, the trade loss was approximately what percentage of the average trade loss?
Read the following graph and answer the questions that follow. निम्नलिखित ग्राफ को पढ़िए और...
The number of graduates in town F is what percentage higher than the number of postgraduates in the same town ?
Direction: The table given below show the data of graduates and postgraduates residing in various...
What is the average sale of bikes of all five companies.
The bar graph shows the sales of bike and cars of five companies J, K,...
The difference between the average gross profit and the average net profit calculated for four years is:
Study the given graph carefully and answer the questions that follow. दिए गए ग्राफ का ध्यानपूर्वक...