Study the following bar graph and answer the following question.
Study the following bar graph and answer the following question.
निम्नलिखित बार ग्राफ का अध्ययन करें और निम्न प्रश्न का उत्तर दें
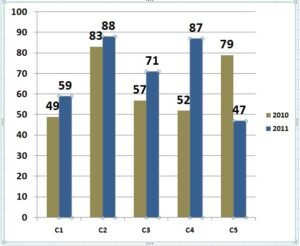
Sales of books (in thousands) from 5 branches (C 1, C 2, C 3, C 4 and C 5) of a publishing company for two consecutive years 2010 and 2011. What is the average sales of all the branches (in thousands) in the year 2010?
2010 और 2011 के दो लगातार वर्षों के दो एक प्रकाशन कंपनी की 5 शाखाओं(C 1, C 2, C 3, C 4 और C 5) से किताबों (हजारों में) की बिक्री।
वर्ष 2010 में सभी शाखाओं (हजारों में) की औसत बिक्री क्या है?