What is the average production of company C, D, and E ?
The graph shows the demand and production of different companies. Study the graph and answer the questions.
ग्राफ विभिन्न कंपनियों की मांग (Demand) और उत्पादन (Production) को दर्शाता है। ग्राफ का अध्ययन कीजिए और दिए गए प्रश्नों के उत्तर दीजिए।
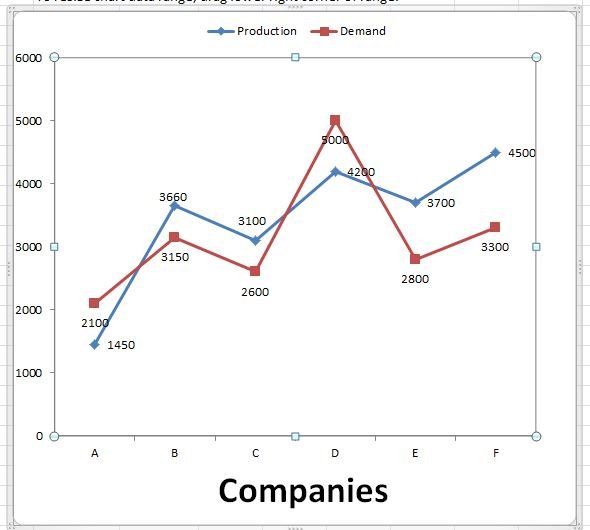
What is the average production of company C, D, and E ?
कंपनी C, D और E का औसत उत्पादन कितना है?
Detailed Solution & Logic
Correct Answer:
3666.68
Company = 3100+ 4200+3700
=$ \frac{11000}{3}$ = 3666.68
Similar Practice Questions
In the year 2020, for which crop was the increase in production over the previous year the highest?
Year / वर्ष Wheat / गेहूँ Rice / चावल Barley / जौ Other Grains /...
What is the ratio of females to children in Area R?
Q: The following table represents the population of four different areas and the percentage of...
Approximately what percentage of the total production during the period 2016 to 2020
Year / वर्ष Wheat / गेहूँ Rice / चावल Barley / जौ Other Grains /...
What is the difference (in million tonnes) between the average production of Rice
Year / वर्ष Wheat / गेहूँ Rice / चावल Barley / जौ Other Grains /...
In which year was the difference between the highest marks and the average marks in History
Year / वर्ष English (Maximum) / अंग्रेजी (अधिकतम) English (Average) / अंग्रेजी (औसत) Mathematics (Maximum)...
The ratio of the production of scooters by factory P to that by factory T in 1985 is:
Study the table carefully and answer the questions given below. Yearly production (In thousands) of scooters...
What was the percentage increase in the production of barley in 2019 compared
Year / वर्ष Wheat / गेहूँ Rice / चावल Barley / जौ Other Grains /...