What is the difference between the average demand and the average production
The graph shows the demand and production of different companies. Study the graph and answer the questions.
ग्राफ विभिन्न कंपनियों की मांग (Demand) और उत्पादन (Production) को दर्शाता है। ग्राफ का अध्ययन कीजिए और दिए गए प्रश्नों के उत्तर दीजिए।
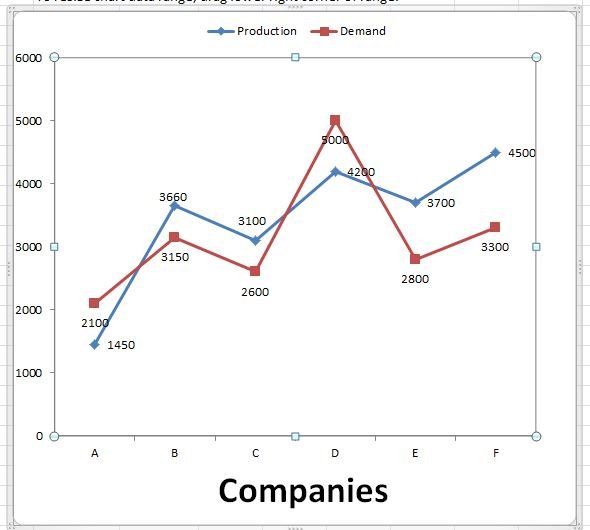
What is the difference between the average demand and the average production of the companies (in lakh tonnes)?
कंपनियों की औसत मांग तथा औसत उत्पादन के बीच कितना अंतर है (लाख टन में)?
Detailed Solution & Logic
Correct Answer:
275
$ \frac{2100+3150+2600+5000+2800+3300}{6}$
=$ \frac{18950}{6}$
Average production
=$ \frac{1450+3660+3100+4200+3700+4500}{6}$
=$ \frac{20610}{6}$
Required difference
= $ \frac{20610}{6}$ -$ \frac{18950}{6}$
=$ \frac{1660}{6}$ = 2767 lakh tonnes
$ \frac{2100+3150+2600+5000+2800+3300}{6}$
=$ \frac{18950}{6}$
औसत उत्पादन
=$ \frac{1450+3660+3100+4200+3700+4500}{6}$
=$ \frac{20610}{6}$
अभीष्ट अंतर
= $ \frac{20610}{6}$ - $ \frac{18950}{6}$
=$ \frac{1660}{6}$ = 276.7 लाख टन
Similar Practice Questions
If the total contribution by FII is ₹ 33,000 crore, then the funds contributed towards the subscription of Bharat Bonds by NRIs and Banks are :
Directions : The following pie chart shows the subscription generated for Bharat Bonds. Study the...
The sales of car is how much percentage more then the sales of bike in companies L ?
The bar graph shows the sales of bike and cars of five companies J, K,...
The given table shows the marks obtained by 100 students out of 50 marks in Mathematics and Physics in an examination.
The given table shows the marks obtained by 100 students out of 50 marks in...
In which of the following years was the percentage increase in loss the highest
Read the following graph and answer the questions that follow. निम्नलिखित ग्राफ को पढ़िए और...
Student 4 got 60 marks in Geography. His marks in History are:
Directions (81–85): The questions are based on the graph given below. Answer the following questions....
In which year was the total production of scooters of all factories 20% of the total production during 1985–1989?
Study the table carefully and answer the questions given below. Yearly production (In thousands) of scooters...
What is the ratio of the companies having more demand than production to those
The graph shows the demand and production of different companies. Study the graph and answer...