What is the percentage increase in the number of players from Game D to Game E in School M?
Study the given graph carefully and answer the question that follows.
दिए गए ग्राफ का ध्यानपूर्वक अध्ययन कीजिए और उसके आधार पर निम्नलिखित प्रश्न का उत्तर दीजिए।
The bar graph shows the number of players participating in two games in six different schools L, M, N, P, Q, and R.
यह बार ग्राफ छह विभिन्न विद्यालयों L, M, N, P, Q और R में दो खेलों में भाग लेने वाले खिलाड़ियों की संख्या को दर्शाता है।
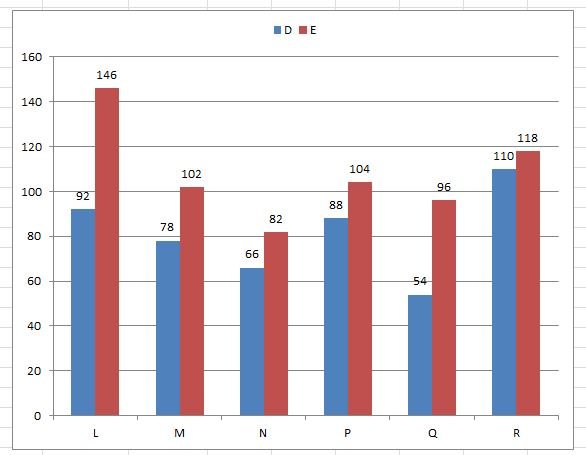
Q: What is the percentage increase in the number of players from Game D to Game E in School M?
विद्यालय M में खेल D से खेल E तक खिलाड़ियों की संख्या में कितने प्रतिशत की वृद्धि हुई?
 %
%