What is the value of (p2-p1) ?
The bar graph shows the sales of bike and cars of five companies J, K, L, M, and N.
बार ग्राफ पाँच कंपनियों J, K, L, M और N द्वारा बेची गई बाइकों तथा कारों की संख्या को दर्शाता है।
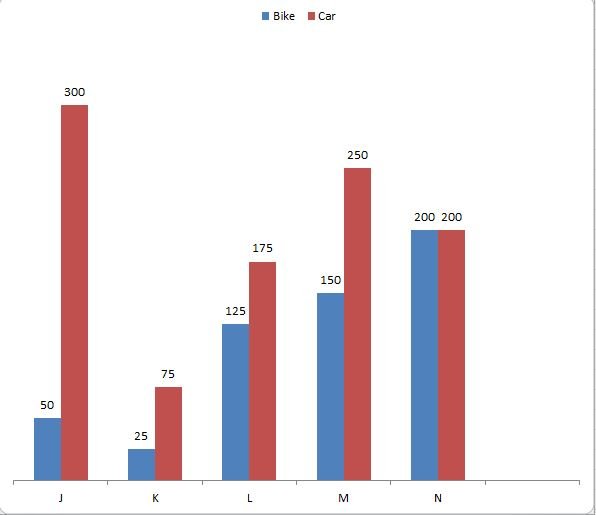
P1 = The total sales of bikes of all the 5 companies. / पाँचों कंपनियों द्वारा बेची गई बाइकों की कुल बिक्री।
P2 = The total sales of cars of all the 5 companies./ पाँचों कंपनियों द्वारा बेची गई कारों की कुल बिक्री।
Q. What is the value of (p2-p1) ?
(P2 – P1) का मान क्या है?
Detailed Solution & Logic
Correct Answer:
450
Similar Practice Questions
What was the ratio of the trade loss in the year 2015 to that in the year 2018?
Read the following graph and answer the questions that follow. निम्नलिखित ग्राफ को पढ़िए और...
Student 4 got 60 marks in Geography. His marks in History are:
Directions (81–85): The questions are based on the graph given below. Answer the following questions....
The mean marks of the following distribution is:
The mean marks of the following distribution is: निम्नलिखित बंटन के माध्य अंक ज्ञात कीजिए।
What percentage of loss incurred in the selling of article D ?
The table given below shows the cost price and selling price of four articles ....
What was the percentage increase in the loss in 2019 compared to the loss in 2015?
Read the following graph and answer the questions that follow. निम्नलिखित ग्राफ को पढ़िए और...
The number of accounts opened in August is approximately what percent more or less
Directions (96–100): Study the table given below and answer the following questions. निर्देश (96–100): नीचे...
How many students got more marks in History than in Geography?
Directions (81–85): The questions are based on the graph given below. Answer the following questions....