Calculate the average number of players in Game E across all schools.
Study the given graph carefully and answer the question that follows.
दिए गए ग्राफ का ध्यानपूर्वक अध्ययन कीजिए और उसके आधार पर निम्नलिखित प्रश्न का उत्तर दीजिए।
The bar graph shows the number of players participating in two games in six different schools L, M, N, P, Q, and R.
यह बार ग्राफ छह विभिन्न विद्यालयों L, M, N, P, Q और R में दो खेलों में भाग लेने वाले खिलाड़ियों की संख्या को दर्शाता है।
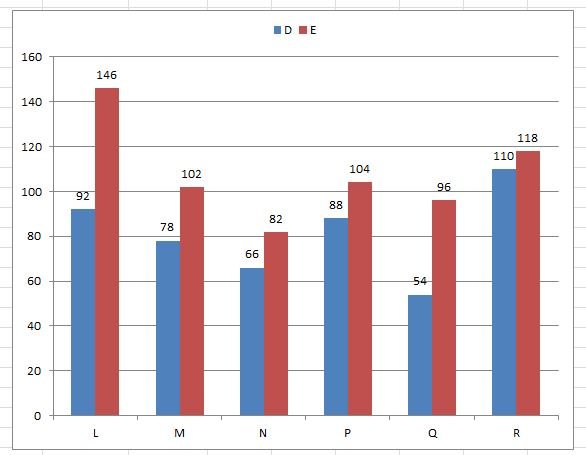
Q: Calculate the average number of players in Game E across all schools.
सभी विद्यालयों में खेल E के खिलाड़ियों की औसत संख्या ज्ञात कीजिए।
Detailed Solution & Logic
Correct Answer:
108
Answer: B) 108
Total number of players in game E:
146+102+82+104+96+118=646.
Average is :

Similar Practice Questions
What is the average production of company C, D, and E ?
The graph shows the demand and production of different companies. Study the graph and answer...
In which year was the difference between the highest marks and the average marks in History
Year / वर्ष English (Maximum) / अंग्रेजी (अधिकतम) English (Average) / अंग्रेजी (औसत) Mathematics (Maximum)...
The total cost price of D, E and F is what percent of the total selling price of E, F and G ?
The table given below shows the cost price and selling price of four articles ....
Which salesman’s commission in 2018 showed the highest increase over that in 2015?
Directions (91–95): Read the following table and answer the questions given below it. निर्देश (91–95):...
In which area is the number of males equal to the number of children?
Q: The following table represents the population of four different areas and the percentage of...
If the investment by NRIs is ₹ 8,000 crore, then the combined investment by Companies and FII in Bharat Bonds is
Directions : The following pie chart shows the subscription generated for Bharat Bonds. Study the...
In the year 2018, the commission earned by Salesman B was approximately what percent
Directions (91–95): Read the following table and answer the questions given below it. निर्देश (91–95):...