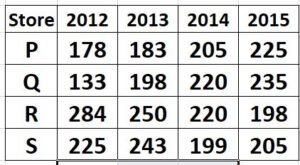
The table below shows the number of mobile phones sold by four different stores in four different years.
The table below shows the number of mobile phones sold by four different stores in four different years.
निम्न तालिका चार अलग – अलग वर्षों मे चार अलग – अलग स्टोर द्वारा बेचे गए मोबाइल फोन की संख्या को दर्शाती हैं।
Detailed Solution & Logic
Correct Answer:
7
The question asks for the difference between the number of mobile phones sold by Store Q in 2013 and Store S in 2015.
Step-by-Step Calculation:
Store Q in 2013: 198
Store S in 2015: 205
Difference: 205 -198 =7
Final Answer: 7
Similar Practice Questions
The ratio of the production of scooters by factory P to that by factory T in 1985 is:
Study the table carefully and answer the questions given below. Yearly production (In thousands) of scooters...
In which of the following years was the difference between the highest and the
Directions (91–95): Read the following table and answer the questions given below it. निर्देश (91–95):...
What is the difference (in million tonnes) between the average production of Rice
Year / वर्ष Wheat / गेहूँ Rice / चावल Barley / जौ Other Grains /...
If the bike production of Company C were to increase by 25%, what would be the new
The table given below shows the production of bike and truck by five companies. नीचे...
What is the average production of company C, D, and E ?
The graph shows the demand and production of different companies. Study the graph and answer...
In which school is the ratio of players in Game D to Game E the highest?
Study the given graph carefully and answer the question that follows. दिए गए ग्राफ का...
The production of company A is approximately what per cent of the demand
The graph shows the demand and production of different companies. Study the graph and answer...